Understanding Trendlines
Trendlines are fundamental tools in price action trading, serving as visual indicators of market direction. They help traders to identify best support and resistance areas,thus they are crucial components of successful trading strategies. Understanding how to draw and perfect use of trendlines can significantly enhance your trading decisions.
A trendline is a visual line plotted on a chart, connecting a series of price points to indicate potential support or resistance levels and the overall market direction. It can be either a support trendline, which slopes upwards, or a resistance trendline, which slopes downwards. The direction of the trendline helps traders understand whether the market is in an uptrend or downtrend.
How to draw Trendlines?
There are two primary methods for drawing trendlines: connecting the bodies of candlesticks OR connecting the wicks. Both methods have their merits, but one is generally preferred for better accuracy.
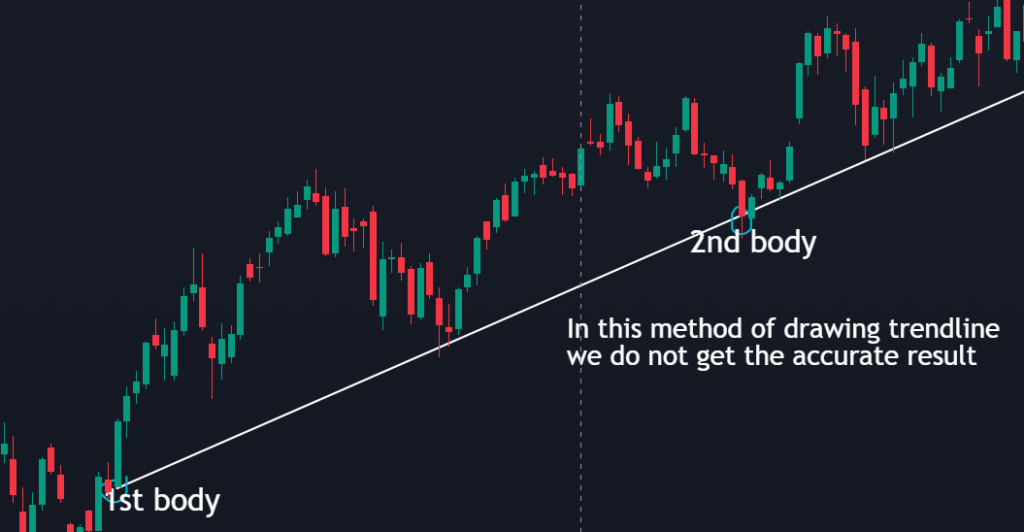
- Connecting bodies
- Connecting wicks

The preferred method is to connect the wicks of the candlesticks. This approach tends to provide more reliable trendlines, as it captures the extremes of price movements. While connecting bodies can still yield valid trendlines, it may not reflect the full price action as effectively.
Why Use Trendlines?
Trendlines are crucial for trade identification. They help traders spot potential breakout and breakdown points in the market. By analyzing the behavior of price around trendlines, traders can make informed decisions about entering or exiting trades.


Validating Trendlines
To be effective, a trendline must be validated. This means that not only should it connect two price points, but it also needs a third point to confirm its validity. A trendline that fails to be respected by the price action is not reliable.

Consider the following points regarding valid trendlines:
- Connect atleast three points to form the trendline.
- A third point must touch the trendline for validation.
- Only a few trendlines will be valid among many drawn.
Traders often make the mistake of assuming that merely connecting three wicks constitutes a valid trendline. However, it’s essential to focus on pivots—defined as significant points where the price reverses direction.
Common Mistakes in Drawing Trendlines
Many traders struggle with drawing trendlines effectively. Bellow listed some very common trendline drawing mistakes which should be avoided:
- Connecting random wicks without considering pivots.

- Assuming three touches make a valid trendline.

- Using bodies instead of wicks for connection.

- Drawing trendlines without market context.

To ensure you are drawing trendlines accurately, focus on identifying proper pivots. A pivot is a point where the price reverses direction, and it’s crucial for confirming the validity of a trendline.

Identifying Pivots
Pivots are essential for establishing valid trendlines. They represent significant price points where the market has reacted, either reversing or continuing its trend. When drawing trendlines, make sure to look for clear pivot points:
- Look for clear reversals in price.
- Ensure pivots are distinct and not just minor fluctuations.
- Connect multiple pivots to strengthen the trendline.
Practical Examples of Trendlines
Understanding trendlines through practical examples can solidify your knowledge. For example, consider a scenario where the price repeatedly respects a trendline, and take support from it at least three times. This behavior indicates a strong trend and provides a potential trading opportunity.

Conversely, if the price breaks through a trendline without validating it first, it may signal a trend reversal. Traders should be cautious and reconsider their positions in such cases.
Conclusion
Mastering trendlines is an essential skill for any trader. By understanding how to draw, validate, and apply trendlines in your trading strategy, you can significantly improve your trading outcomes. Remember to focus on connecting pivots and validating your trendlines to avoid common mistakes.
As you continue your trading journey, keep practicing drawing trendlines on various charts. The more you familiarize yourself with their behavior, the more confident you will become in utilizing them effectively in your trading strategy.
FAQ’S
How many touch points are needed for a valid trendline?
There should be atleast 3 pivot points should touch the line for a valid trendline. If more points touch the line ,then it will be considered as a strong trendline and there is a strong chance that the trend will be reversed.
What happens when a trendline is broken?
Usually trendline represent how is the trend right now, and if the the trendline broken then it can be a sign of trend shift.
Can someone take trade directly if the trendline broken ?
No, first use the trendline with your trading strategy and check your trading rules .Then plan accordingly.
Your blog is a treasure trove of valuable insights and thought-provoking commentary. Your dedication to your craft is evident in every word you write. Keep up the fantastic work!